Assignment 2.1:
Vicinity Site Diagram (2D)
Assignment 2.2:
Analytical Site Diagram (3D)

01 In-Class exercise –
Assignments 2.1 & 2.2
Continue to develop the Vicinity and 3D Analytical diagrams
- Make a list of discussion/feedback/critique items about your Vicinity and 3D Analytical diagrams.
- Make a third list, words only, no visuals, with a minimum of four project design opportunities, challenges, and concerns that could be addressed better than you currently show. Be specific in relation to your project. Some possibilities include:
- PROGRAMMATIC – My lounge idea could be affected by the wind, so I should show the direction(s) and strength on the 3D diagram to communicate this challenge
- SPATIAL – I want sunlight to come into the lobby, so I need to show on my 3D diagram the directions that I need to have openings
- SEASONAL – I want to have a cool shade structure in the pool area, but it might need to change location throughout the year as my 3D analysis shows
- ACCESS – I plan to have special events in the pool area during the summer, so Ubers are going to queue for drop-off and pick-up; this could be a problem for regular hotel guests to check in/out easily during the events. How can I show this on the 3D analysis as a problem to be solved?
- PROXIMITY – How can I show on my Vicinity diagram the challenges of taking advantage of my brand’s partnerships with businesses across town, while also demonstrating my brand’s support of carbon-zero transportation?
- SEASONAL – The view from the roof is great — except at this time of year in this direction because of the smog as I show on the 3D analysis
- SPATIAL – You can see the Hollywood sign from the roof — but there is tall building that blocks it from this corner as my 3D analysis shows
- many other types of opportunities and challenges
- Before the end of class today, place these lists in your Week 3 Miro space.
- Add labels, flags, markers, and legends to the diagrams as appropriate.
- Make sure your 3d Analytical diagram has a north arrow.
Illustrator tutorial 02
CLICK HERE to download the tutorial file
02 Mapping Time – Slide
Statistics

Art Center Library Online Resources
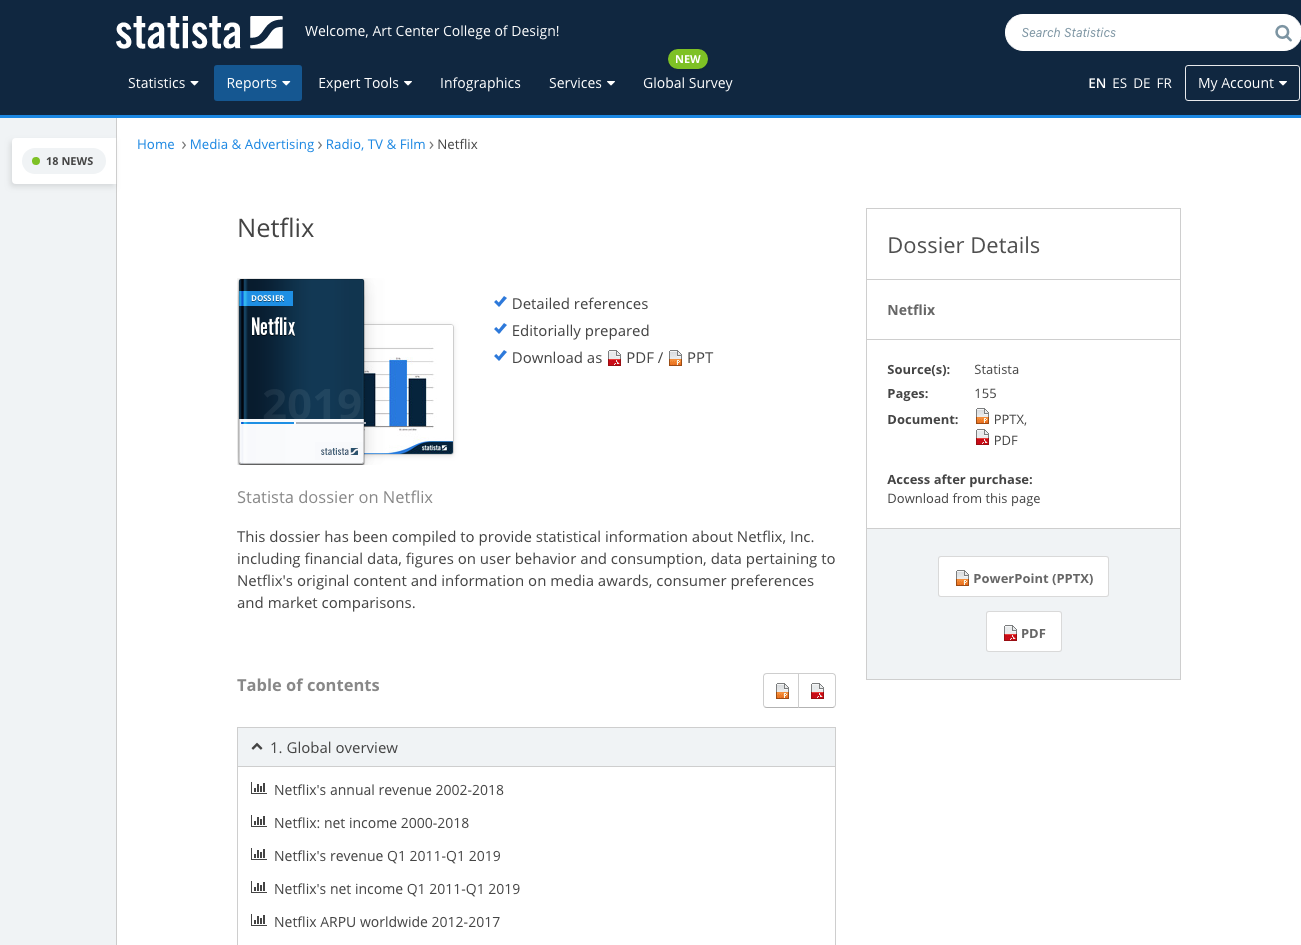
Break into teams. Search on Statista for
- Airbnb
- Uber
- Netflix
Each time will extract quantifiable and time-based data and pinup to Miro for discussion.
Discussion session
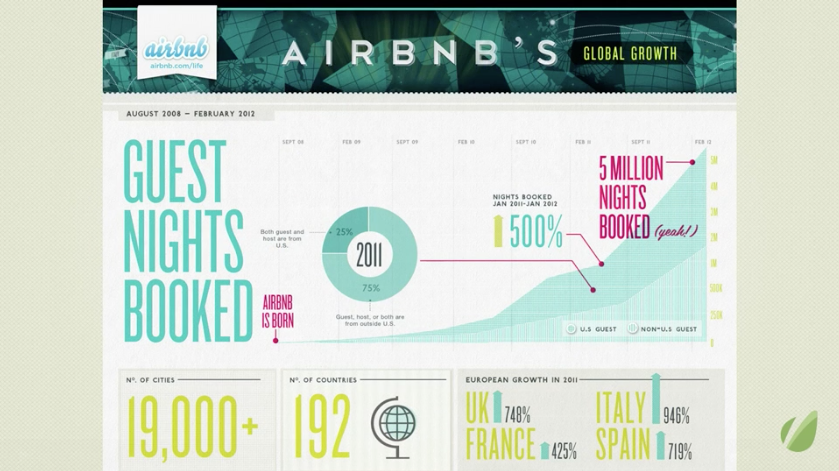
- How to map concept of time?
- Time as linear concept or non linear concept?
- X-Axis = time
- Y-Axis = quantifiable number
- Insert important events with pictogram
LAB session
- Layout basic timeline
- Sketch out events
Assignment 3.1
Mapping time ( 1920x1080px)
- Go to Statista and find quantifiable data
- Create a time diagram based on the information
- Be precise about numbers, and proportional representation of the quantity
- In a clear graphics, explain what triggered a major change in numbers
- The important question is, by mapping this instance, what are you trying to reveal?
Assignment 3.2
Site Diagram Revisions and List of Detailed Concerns
Assignment 3.3 (Tracing World Cup Prediction Diagram)
TRACING THE WORLD CUP PREDICTION
(FROM INFORMATION GRAPHICS, P.310)
- Quantifying objects precisely
- Scale with scale factor
- Using Align tools and Rotation tools, create precise guides for quantities and measurements. Lock the guides, and use them to organize information.
- Turn off Snap to Pixel
- Toggle Preview Mode on/off to be more precise
- Click here or the image below to go to our Google Drive to download the image below and the instructions.
- Click here for the YouTube tutorial and follow along.
-
- Import the image into Illustrator.
- Place in on its own layer and lock it.
- Reproduce the diagram by tracing the image.
- Become familiar with the tools that allow precise geometric construction:
- proportional scaling
- accurate rotations
- spacing items equally
- aligning things accurately


