
Student Presentations
Assignment 4.1
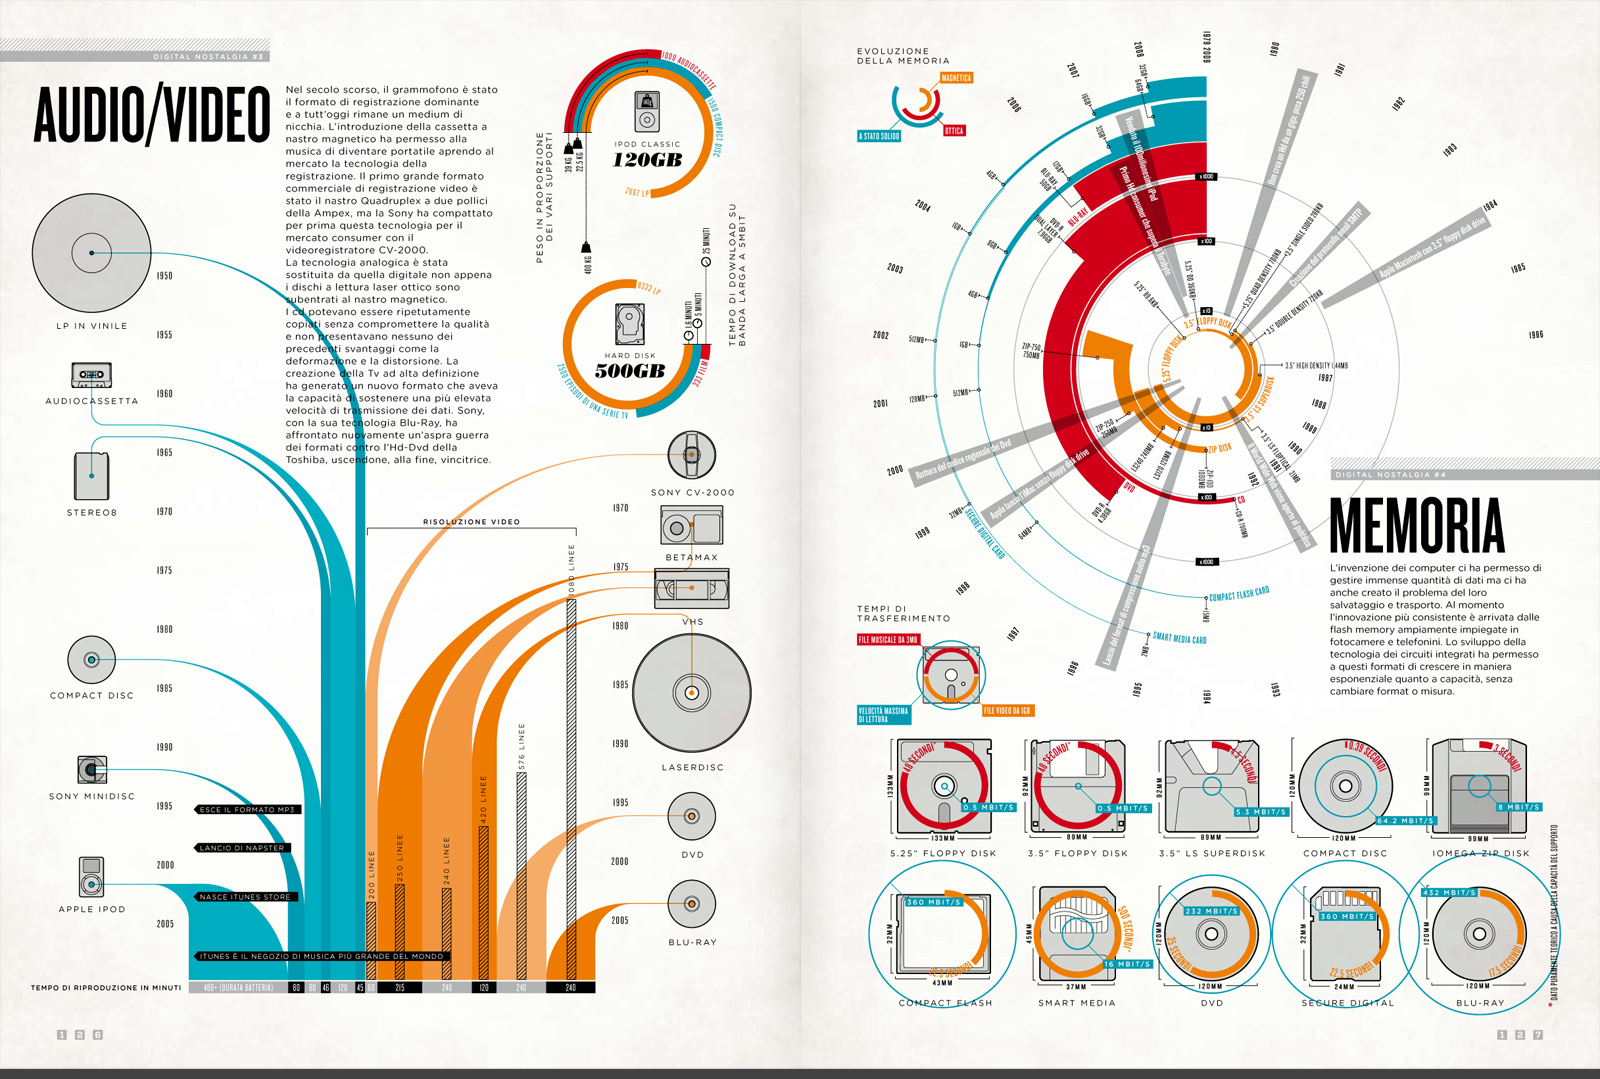
Mapping time (2160×1920 color PDF)
- Go to Statista or any other statistical information source and find quantifiable, time-based data for a specific company.
- Find 3-5 datasets that are related by time.
- Create a time diagram based on the information. Do not copy and paste diagrams that you find. Translate the data into your own graphics.
- Synthesize the data – put them together into a single, cohesive large-format graphic that clearly reveals relationships and correlations between the datasets.
- The graphic should explain what triggered major changes in numbers – milestone events.
- Hypothetical example for Apple, Inc.:
- Dataset 1 = Timeline of annual revenue
- Dataset 2 = Timeline of product introductions
- Overlay the data to show that the introductions of the iPod and iPad correlated with spikes in revenue.
- Be precise about numbers and use proportional representation of quantities.
- The important question is: by mapping this instance, what are you trying to reveal?
Assignment 4.2
Tracing Diagram (1920×1080 color PDF)
If you have not made much progress tracing the World Cup Prediction, complete that for Assignment 4.2.
If you were able to complete the World Cup Prediction tracing, choose a new, appropriate (meaning approved by the instructor) graphic, and trace it in Adobe Illustrator exactly the same way. Some sources:
-
- Information Graphics book
- from searching for “information graphics” on the web.
- Nicholas Felton’s work
- Valerio Pellegrini’s work
- Paul Button’s work: link 1 / link 2
Upload your 1920×1080 color PDF to the class Google Drive along with a screen capture/download of the original graphic.
Assignments 2.1 & 2.2 development
Continue progress on the Site Diagrams (2D Locating and 3D Analytical)
01 Charette: God of Love
Watch2Gether as a class by clicking here.

- In class, sketch a diagram that includes:
- All characters
- Story
- Events
- Time
- Locations / settings
- Mood
- Music
- Props
- Pay special attention to graphically depicting RELATIONSHIPS and CONNECTIONS.
How would you show relationships between characters and non-human items?
Progress Pinup: God of Love
02 Program & Circulation

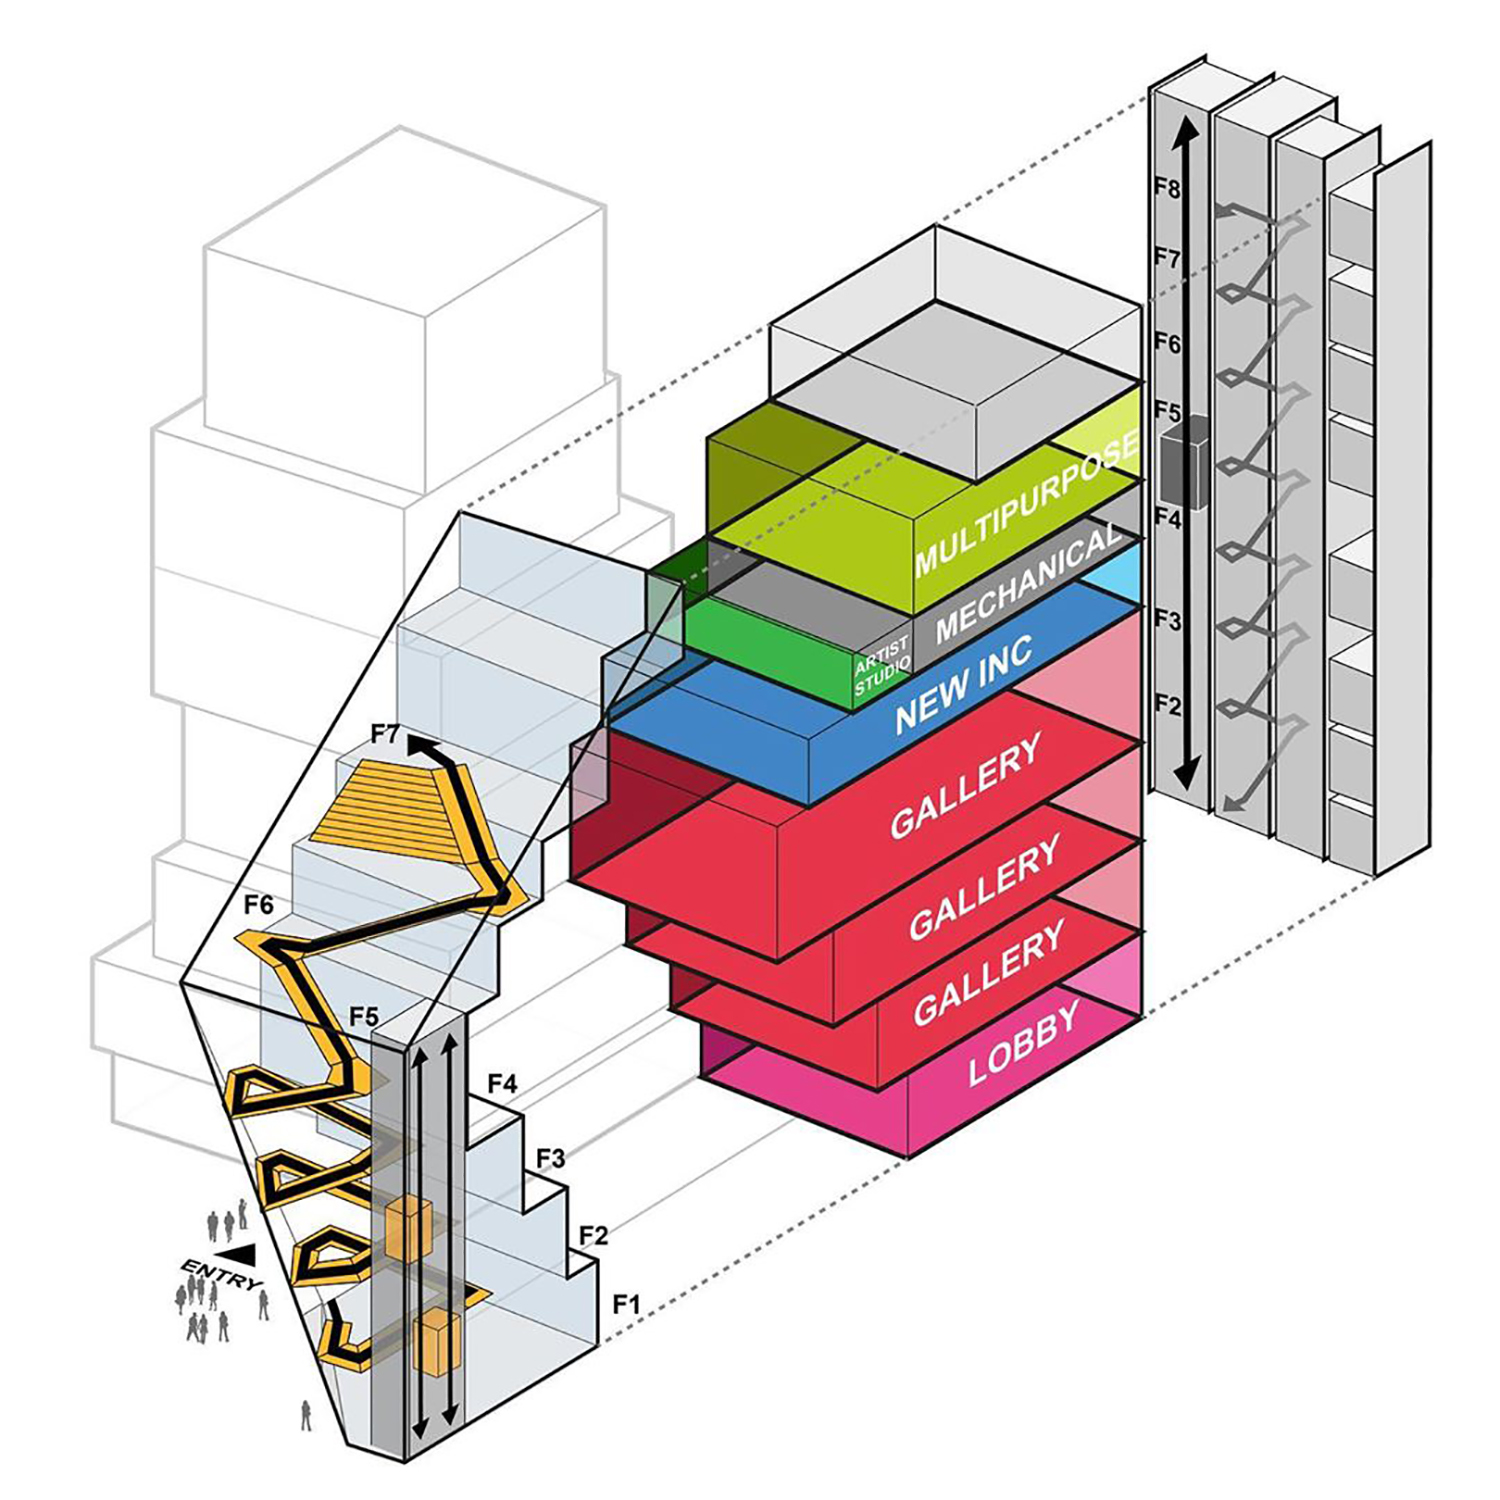
Programmatic Diagram Past Examples
Other examples:
- Seattle Central Library by OMA
- CCTV Headquarters by OMA
- Rijstraat 8 by Ellen van Loon and OMA
- Dee and Charles Wyly Theater by REX and OMA
03 In-Class Sketch Exercise (45 minutes) + Pinup
Sketch out a program & circulation diagram for your ENV-3 project. Feel free to use hand sketching or the computer. Below is an example Illustrator file of a Rhino export — similar to what we have done with the 3D Analytical Site Diagram.
Notice how the individual program elements are separated into individual layers.
04 Desk Crits
Sign up on Bluescape under Week 5.
Have these things ready to talk about:
-
- ENV3 project, either on the ENV3 Bluescape or sharing from your computer
- Assignments 2.1 & 2.2
- Assignments 3.1 & 3.2
- Assignment 4.1
Assignment 5.1:
Program & Circulation Diagram
Continue working on the Programmatic Diagram in Rhino and Illustrator.
Progress pinup Week 6 on Bluescape
Final due on Mid-Term Presentation Week 7.
Assignment 5.2:
Finalize God of Love diagram using Illustrator.
- Create a 2160×1920 color PDF and pinup on Bluescape for Week 6.