
Student Presentations
Assignment 2.1:
Vicinity Site Diagram (2D)
1920×1080 color PDF
Using Adobe Illustrator, create a site diagram that will help your audience to locate your building and show its relationship to various points of interest. The diagram should include overall orienting roads, freeways, public transportation, airports, and so on. The map should also include related landmarks to your project (museums, galleries, sports facilities, parks, coffee shops, similar projects, etc.).
Assignment 2.2:
Analytical Site Diagram (3D)
1920×1080 color PDF
Using Adobe Illustrator, create a 3D diagram for the project to understand the condition of the site and immediate surroundings. The diagram needs to extend at minimum to the buildings on the opposite sides of the street bounding your block. Conditions you should look into include the following:
- Traffic
- Pedestrian Circulation
- Green / water space
- Sun / Shadow
- Neighboring buildings
- View
- Nature / Artificial condition
- Noise
- Wind
- Ephemeral/transient conditions – people, wildlife
- The beach
- Nearby attractions
Understanding the site conditions and context will help you design entry, program distributions, layouts, and etc.
Reading
- Read pages 14-43 of Design is Storytelling by Ellen Lupton.
01 In-Class exercise –
Assignments 2.1 & 2.2
Continue to develop the Vicinity and 3D Analytical diagrams
- Make a two lists of discussion/feedback/critique items about your Vicinity and 3D Analytical diagrams.
- Make a third list, no visuals, with a minimum of four project design opportunities, challenges, and concerns that could be addressed further than you currently show. Try to be specific. Some possibilities include:
- PROGRAMMATIC – My lounge idea could be affected by the wind, so I should show the direction(s) and strength on the 3D diagram to communicate this challenge
- SPATIAL – I want sunlight to come into the lobby, so I need to show on my 3D diagram the directions that I need to have openings
- SEASONAL – I want to have a cool shade structure in the pool area, but it might need to change location throughout the year as my 3D analysis shows
- ACCESS – I plan to have special events in the pool area during the summer, so Ubers are going to queue for drop-off and pick-up; this could be a problem for regular hotel guests to check in/out easily during the events. How can I show this on the 3D analysis as a problem to be solved?
- PROXIMITY – How can I show on my Vicinity diagram the challenges of taking advantage of my brand’s partnerships with businesses across town, while also demonstrating my brand’s support of carbon-zero transportation?
- SEASONAL – The view from the roof is great — except at this time of year in this direction because of the smog as I show on the 3D analysis
- SPATIAL – You can see the Hollywood sign from the roof — but there is tall building that blocks it from this corner as my 3D analysis shows
- many other types of opportunities and challenges
- Place a draft of the three lists in the same space where you pinned up this Week 3 before the end of class time Week 3.
- Add labels and flags to the diagrams as appropriate.
- Make sure your 3d Analytical diagram has a north arrow.
02 What is a design story?
DESIGN is Storytelling by Ellen Lupton
- Narrative Arc – as space: entry, peaks of experience, climactic moments, the exit
- Hero’s Journey – who are the characters experiencing the space? What is the “takeaway”?
- Storyboard – how can we distill our design idea and story into a concisely-curated set of images?
- Rule of Threes – a fairly universal organizing principle that helps to create a lasting impression
Why are these even useful tools for spatial designers?
- Stories are effective means of communication, and going back at least to the Middle Ages, architecture has been infused with narrative content or been related to story.
- Sharper definition our design stories.
- Clarity of intent at each episode.
- Varied experience – not flat.
03 Conceptual Diagrams
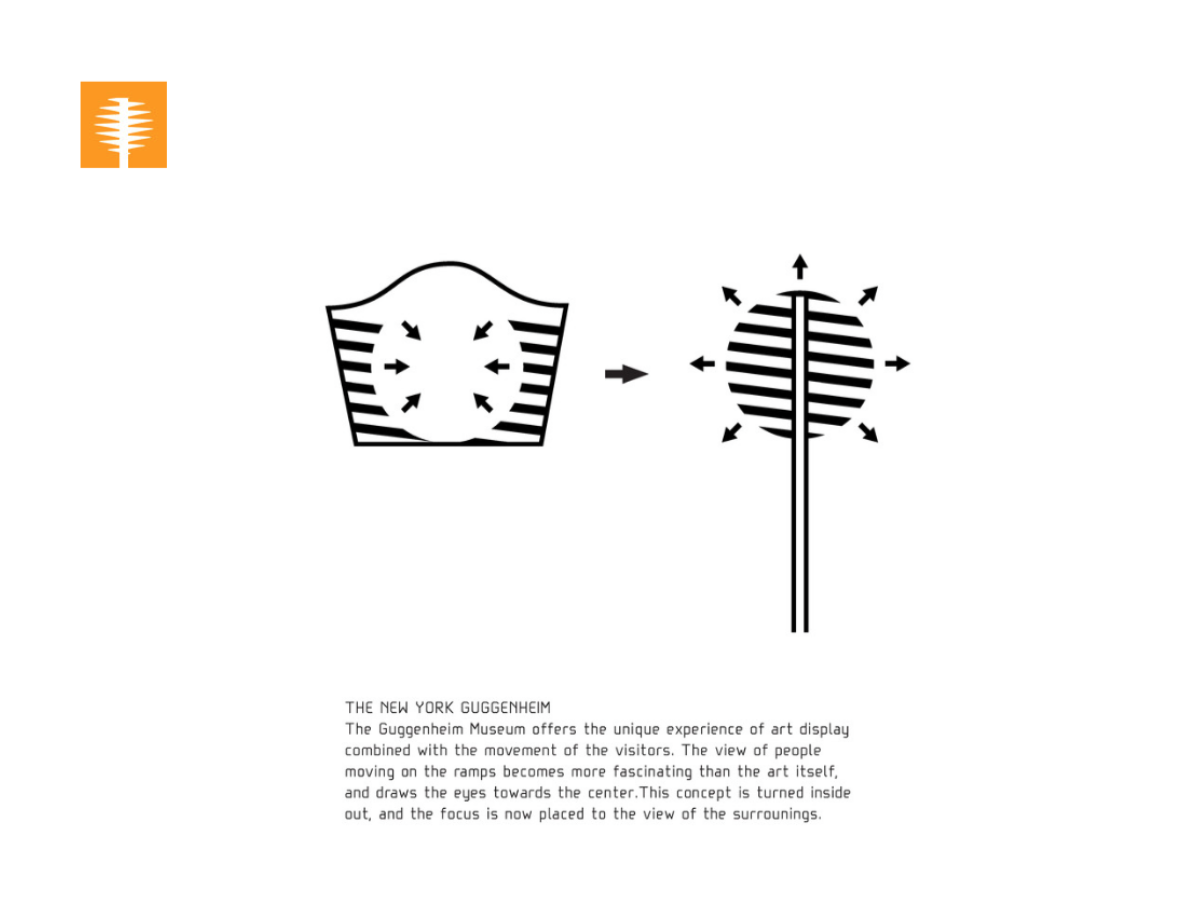
How to tell a simple story through a technique of simple cartoon? In 2 to 4 frames, visually tell the story about your project (concept statement) in a straightforward way.
Download the slides from our Google Drive here.
04 Sketchbook Charette: LEGO House by BIG
Watch2Gether link here
https://big.dk/#projects-leg
Concept Statement by BIG
“Lego House is a literal manifestation of the infinite possibilities of the Lego brick – one that embodies the notion of systematic creativity and allows children of all ages countless opportunities to create their own worlds and to inhabit them through play,” said Ingels.
“At its finest, that is what architecture, and Lego play, is all about: empowering people to imagine new worlds that are more exciting and expressive than the status quo – and to provide them with the tools and the skills to make them reality.”
In-Class Exercise
- From information in the video and the website, translate the experience of the Lego House into a narrative format using the “narrative arc” from Design is Storytelling.
- Identify the peaks of the narrative arc along the journey through the space – the major events and spaces. What is the climactic moment?
- Take each one of the peaks and create a simple sketch of the spatial experience based on images in the video and on the website.
- Arrange these frames into a sequential storyboard as in this example: Villa Savoye by Le Corbusier
- Simplify and focus on the essential experiences and concepts.
- Evaluate the consistency of your graphic language.
- Package as a multi-frame storyboard diagram.
Lego House Charette – Pinup
05 Illustrator Tutorial 03
Tracing the World Cup Prediction
(from Information Graphics, p.310)
- Quantifying objects precisely
- Scale with scale factor
- Using Align tools and Rotation tools, create precise guides for quantities and measurements. Lock the guides, and use them to organize information.
- Turn off Snap to Pixel
- Toggle Preview Mode on/off to be more precise
- Click here or the image below to go to our Google Drive to download the image below and the instructions.
- Click here for the YouTube tutorial and follow along.

-
- Import the image into Illustrator.
- Place in on its own layer and lock it.
- Reproduce the diagram by tracing the image.
- Try to become as familiar as you can with the tools that allow precise geometric construction:
- proportional scaling
- accurate rotations
- spacing items equally
- aligning things accurately
Assignments 2.1 & 2.2 development
Continue to develop the Vicinity and 3D Analytical diagrams
- Make a two lists of discussion/feedback/critique items about your Vicinity and 3D Analytical diagrams.
- Make a third list, no visuals, with a minimum of four project design opportunities, challenges, and concerns that could be addressed further than you currently show. Try to be specific. Some possibilities include:
- PROGRAMMATIC – My lounge idea could be affected by the wind, so I should show the direction(s) and strength on the 3D diagram to communicate this challenge
- SPATIAL – I want sunlight to come into the lobby, so I need to show on my 3D diagram the directions that I need to have openings
- SEASONAL – I want to have a cool shade structure in the pool area, but it might need to change location throughout the year as my 3D analysis shows
- ACCESS – I plan to have special events in the pool area during the summer, so Ubers are going to queue for drop-off and pick-up; this could be a problem for regular hotel guests to check in/out easily during the events. How can I show this on the 3D analysis as a problem to be solved?
- PROXIMITY – How can I show on my Vicinity diagram the challenges of taking advantage of my brand’s partnerships with businesses across town, while also demonstrating my brand’s support of carbon-zero transportation?
- SEASONAL – The view from the roof is great — except at this time of year in this direction because of the smog as I show on the 3D analysis
- SPATIAL – You can see the Hollywood sign from the roof — but there is tall building that blocks it from this corner as my 3D analysis shows
- many other types of opportunities and challenges
- Place a draft of the three lists in the same space where you pinned up this Week 3 before the end of class time Week 3.
- Add labels and flags to the diagrams as appropriate.
- Make sure your 3d Analytical diagram has a north arrow.
Assignment 3.1
Narrative concept diagram of your ENV-3 project
Create a concept diagram that describes your project as a narrative. This should be a short series of individual graphics that also shows relationships between them.
What is the concept that each individual graphic embodies? What are the relationships between them? What form is the overall narrative – linear, circular, multi-threaded?
Apply the tools from Design is Storytelling, what we did for the Lego House exercise, and the examples shown in class. This should be about communicating your concept for the experience and design story.
Pinup a 1920×1080 color PDF on Bluescape.
Assignment 3.2
Spatial concept diagram of your ENV-3 project
Create a simple, cohesive diagram or small set of diagrams to describe the spatial aspects of your ENV-3 project. How can the tools from Design is Storytelling be applied for this purpose? What is the concept related to each of your spaces?
Pinup a 1920×1080 color PDF on Bluescape.
Assignment 3.3
World Cup Prediction Tracing
Make as much progress as you can on the tracing.
Pinup a 1920×1080 color PDF on Bluescape.