
Student Presentation
Progress review of W2 assignments
- Assignment 2.0 Site Diagram (Locating, Urban) 1920×1080 PDF
- Assignment 2.1 Site Diagram (Analytical, Detail) 1920×1080 PDF
Illustrator tutorial 02
- Different types of flags
- Quantifying objects
- Scale with scale factor
- Relationships
- Friendly / Hostile / Frenemy /
- Linear timeline
- Time
- Time Diagram
- Using Align tools and Rotation tools, create guides for quantity and measure. Lock the guides, and use them to organize information.
Illustrator tutorial 03
Tracing the World Cup Prediction (from Information Graphics, p.310)
Click the image below to view and download the full-size version. It is also in the class’ Week 3 Google Drive folder.

Mapping Time – Slide
Also in the class’ Week 3 Google Drive folder.
Statistics
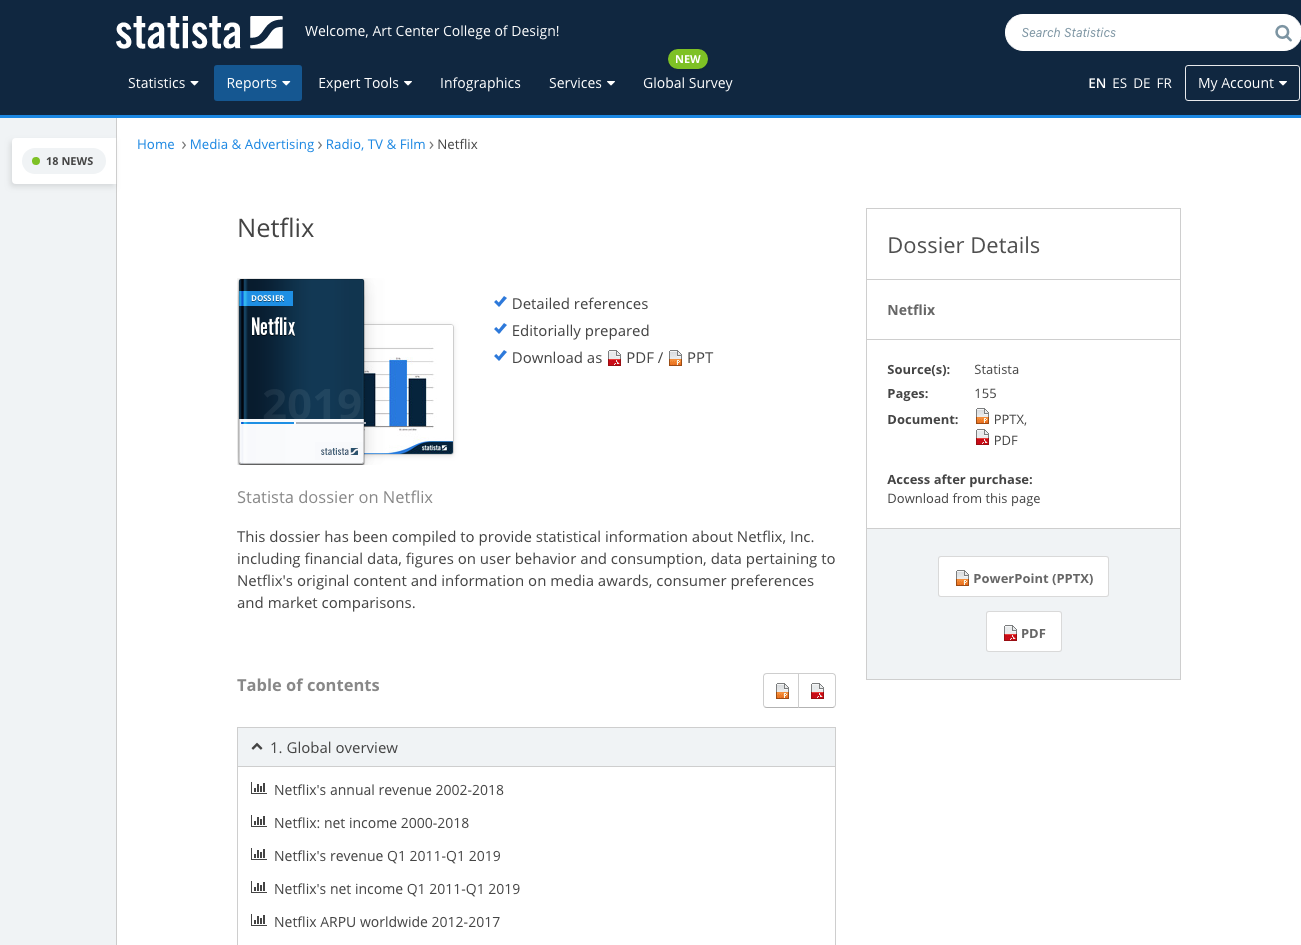
Art Center Library Online Resources
Search on Statista for
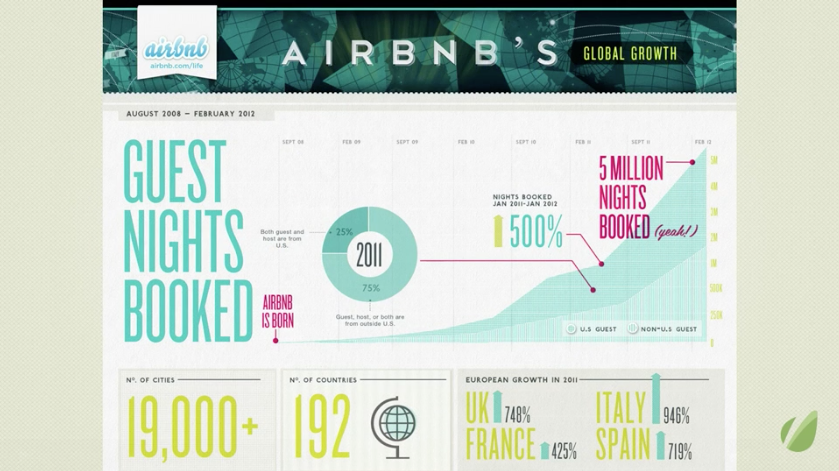
- Airbnb
- Uber or Lyft
- Netflix
The Statista “dossier” is a useful compilation of information.
Discussion session
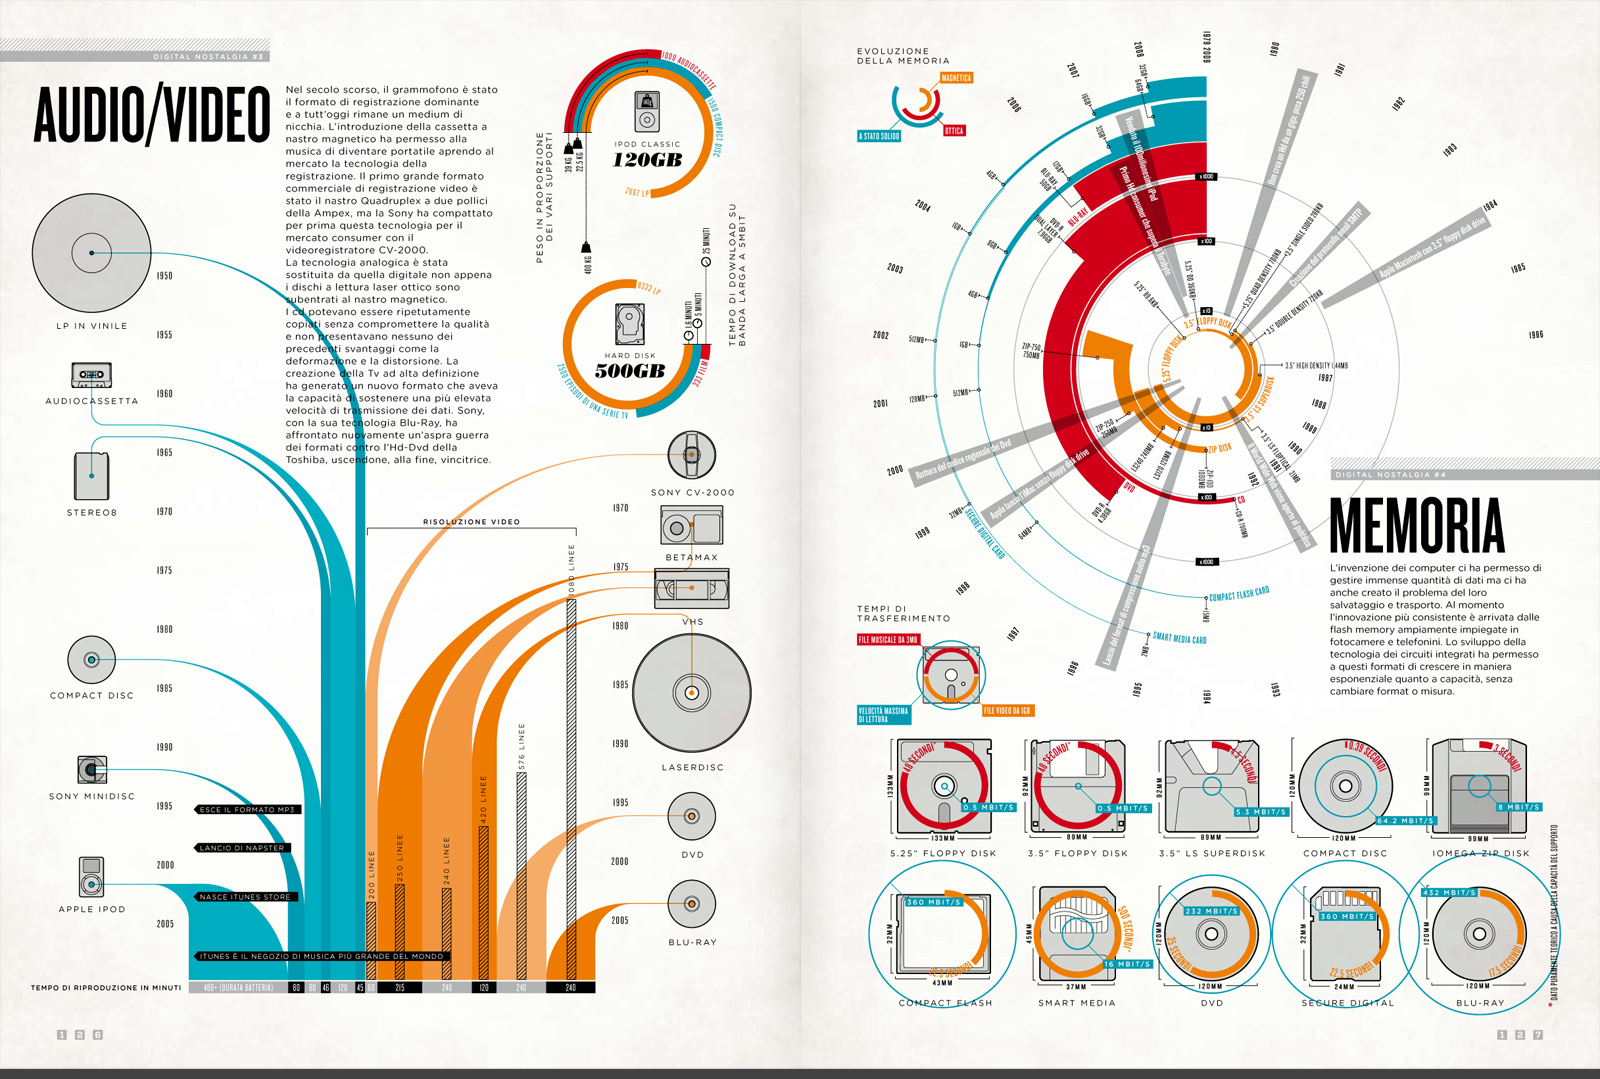
- How to map concept of time?
- Time as linear concept or non linear concept?
- X-Axis = time
- Y-Axis = quantifiable number
- Insert important events with pictograms and flags
- How do different datasets relate? Does one affect another (and another…)?
LAB session – Assignment 3.0 (see below for details)
- Layout basic timeline
- Sketch out events
Assignment 3.0
Mapping time (2160×1920 color PDF)
- Go to Wikipedia or Statista and find quantifiable time-based data. Download it and save it.
- Create a time diagram based on the information.
- Be precise about numbers and use proportional representation of quantities.
- In a clear graphics, explain what triggered a major change in numbers.
- The important question is: by mapping this instance, what are you trying to reveal?
Assignment 3.1 – Site Diagrams
Continue progress on the Site Diagrams (2D Locating and 3D Analytical)
Assignment 3.2
Tracing Diagram (1920×1080 color PDF)
If you have not made much progress tracing the World Cup Prediction, complete that for Assignment 3.2.
If you were able to complete the World Cup Prediction tracing, choose a new, appropriate (meaning approved by the instructor) graphic, and trace it in Adobe Illustrator exactly the same way. Some sources:
-
- Information Graphics book
- from searching for “information graphics” on the web.
- Nicholas Felton’s work
Upload your 1920×1080 color PDF to the class Google Drive along with a screen capture/download of the original graphic.