
Student Presentation
Review of W2 assignments
- Assignment 2.0 Site Diagram (Urban) 11×17″ color print
- Assignment 2.1 Site Diagram (Detail) 11×17″ color print
- Assignment 2.2 Tracing Diagram (Print @ 11×17 color)
Illustrator tutorial 02
- Different types of flags
- Quantifying objects
- Scale with scale factor
- Relationship
- Friendly / Hostile / Frenemy /
- Linear timeline
- Time
- Time Diagram
- Using align tools and rotation tools, create guides for quantity and measure. Use the guide as a locked layer, to start adding some information.
Illustrator tutorial 03
Worldcup Prediction

Mapping Time – Slide
Statistics
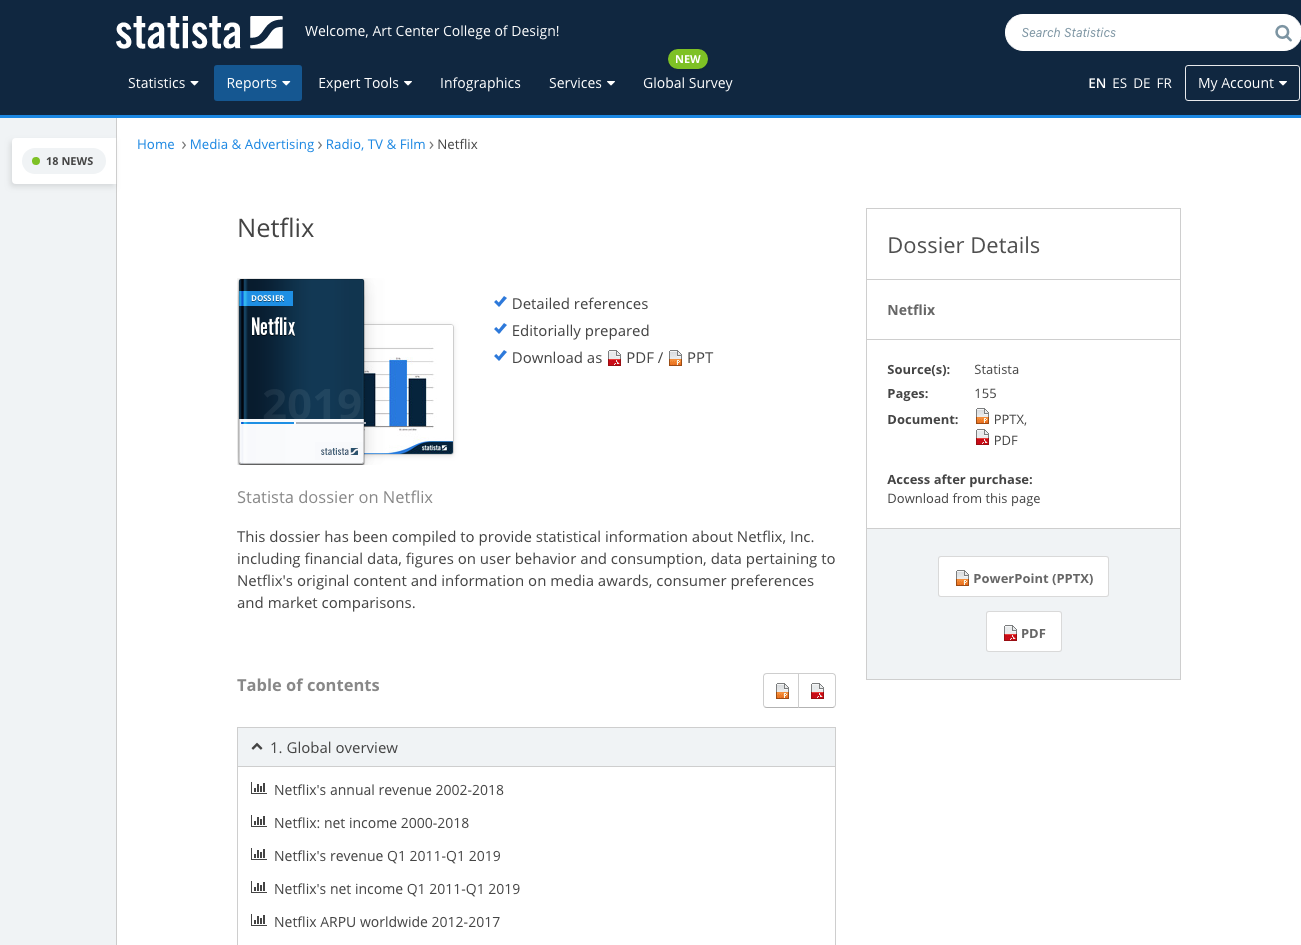
Art Center Library Online Resources
Search on Statista for
- Airbnb
- Uber
- Netflix
Discussion session
- How to map concept of time?
- Time as linear concept or non linear concept?
- X-Axis = time
- Y-Axis = quantifiable number
- Insert important events with pictogram
LAB session
- Layout basic timeline
- Sketch out events

Assignment 3.0
Mapping time (Print @ 22×17″(double 11×17″) color )
- Go to Wikipedia and find a quantifiable data
- Create a time diagram based on the information
- Be precise about numbers, and proportional representation of the quantity
- In a clear graphics, explain what triggered a major change in numbers
- The important question is, by mapping this instance, what are you trying to reveal?
Assignment 3.1 (11×17″ printed)
Site Diagram Revision
Assignment 3.2
Trace 1 diagram from Information Graphics book or similar.
Print@ 11×17″ color